What drives customer retention and repeat buying? Having the right product at the right price is definitely key to keeping your customers. However, when products are easily substituted and prices are competitive it is the service experience that can create your sustainable competitive advantage.
It is the importance of customer service experience to a company’s success that has led many to use survey results in setting management KPI and remuneration. It is also the relative ease of getting customers into a focus group, sending an SMS or email that means it is often done badly with a naive belief if we just ask them how we can do things better we will achieve great things. Without a practical model on how customers evaluate an experience, surveys miss important elements and management relies on a superficial understanding of how to improve customer service.
Ideally, your customer service evaluation model provides both a diagnostic understanding and can predict the type of behaviours that are important to your company. This does not mean one study provides both a diagnostic understanding of business performance and prediction. Diagnostic understanding – evaluation and impact of service delivery elements – needs to follow closely behind service delivery, while predictive results need to be as close as possible to when the decision is made. For a telecommunications client, this meant service delivery evaluations were done directly after significant engagement, while the measures used to predict were done near the end of a contract period.
The service evaluation model we use is based on the model developed by Cronin, Brady and Hult (2000). This model shows how service delivery impacts on behaviour intention using an integrated model that unpacks this complex relationship to show the various drivers of the decision. An added benefit of the model is that it incorporates the Nett Promoter Score (NPS) and Customer Value Analysis (CVA) within its framework.
The diagram below shows the basic outline of the model. From the model, we can see Service Quality – service and product delivery – and Costs drive perceptions of Value. While Service Quality drives Satisfaction, Behaviour Intentions are driven by a combination of Satisfaction, Value and Service Quality. In other words, if a business delivers the right service experience then customers will be satisfied. If this delivery is also at the right price then they will believe it is value for money. A satisfied customer who believes they are getting value will more likely to stay or buy again. To predict actual behaviour we need to understand both intentions and other context information, notably competitive activity, and to take into account the length of time between intention and opportunity to act.
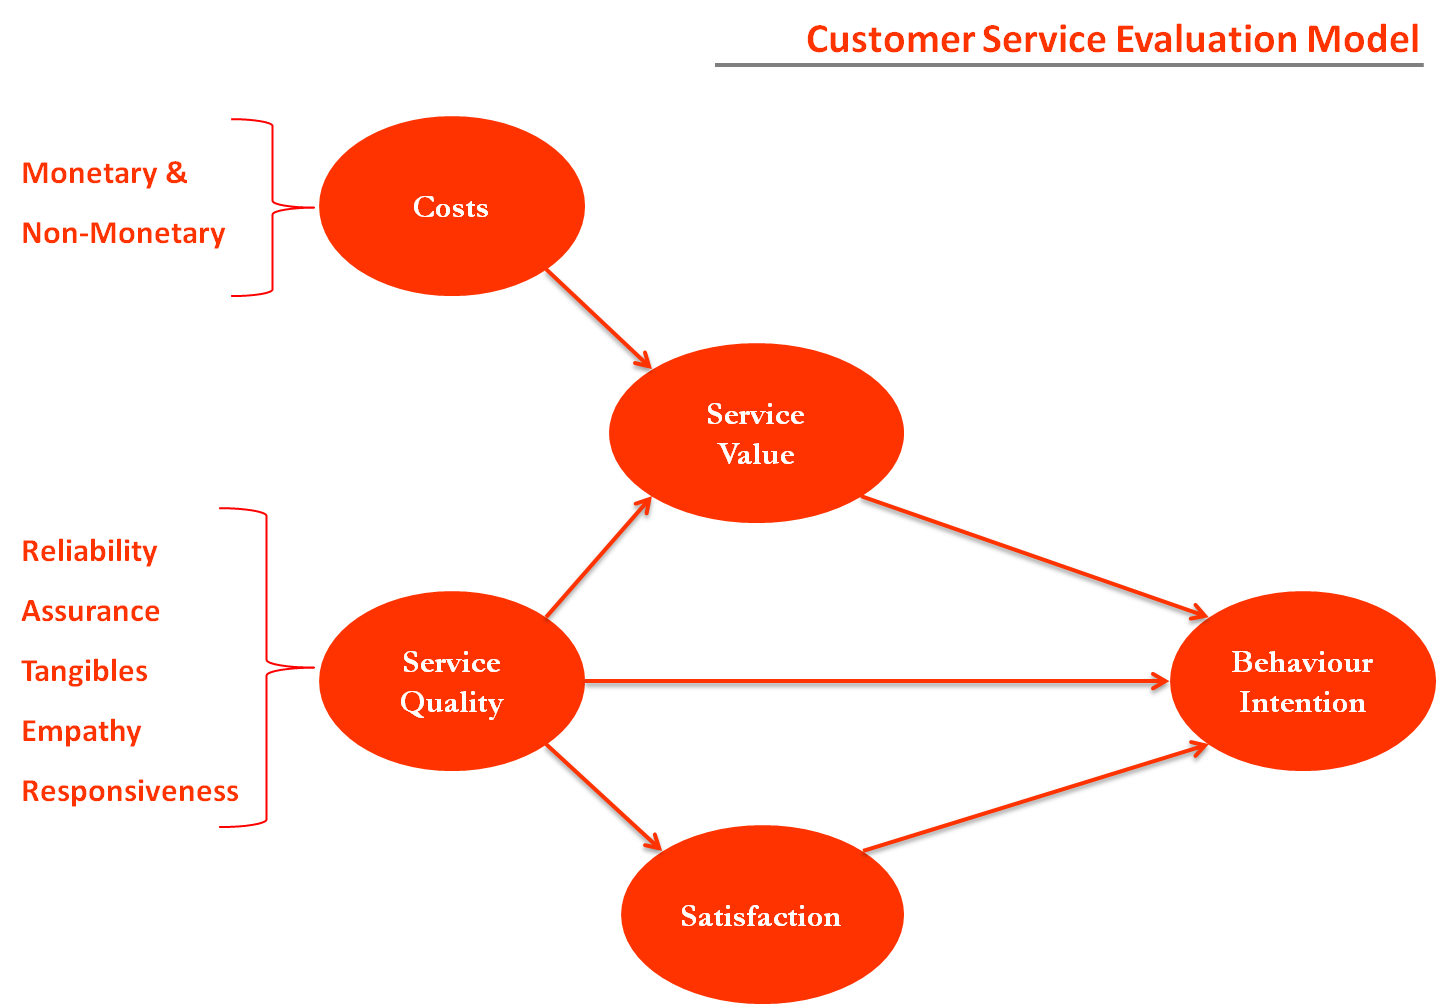
Click to enlarge
From this model, it is easy to see that just measuring satisfaction or recommendations (NPS) misses much-needed details that would help business improve its performance.
Service Quality
Service Quality (SQ) measures business performance at the most basic level that customers can recall and evaluate. Linked to what and how you deliver your service, Service Quality measures also take into account your engagement touchpoints and root causes of service failure to uncover the drivers of satisfaction and dissatisfaction. For a business to maximise the value it gets from Service Quality evaluation the measures should map as closely as possible to what is delivered and customers can easily recall. If a customer can’t clearly recall an area of measurement then they will infer. While inference is what we want in branding research it is not what you want in evaluation research designed to give the service team concrete feedback on what to spend resources on fixing.
When looking for what measures to include for Service Quality a good starting point is the SERVQUAL framework (if you have an MBA or have done a Business degree that word will look very familiar). This framework breaks service quality down into five main areas: Reliability of your service (you deliver on the promise), Assurance (your staff or systems convey that they can deliver), Tangibles (your service setting and communication deliver an experience that adds to the offering), Empathy (you deliver in a way that customers feel valued), and Responsiveness (you deliver efficiently). Each of these measures is broken down into concrete areas to reflect aspects of your service delivery. For example, one aspect of reliability for an industrial client was that orders were complete and that delivery was on time. For an education client reliability was measured in administration, course and teaching areas.
It is important to note that in Service Quality does not just relate to interaction with staff and delivery systems but also includes the product, especially when product quality can vary over time, context and customers.
Cost and Value
Although often ignored in service experience studies, perceptions of value is a driver of satisfaction as customers weight up what they receive against what they have given up to get your service. The relationship between Service Quality and Value are the central measures of Customer Value Analysis (CVA). In CVA Service Quality is generally referred to as Perceived Performance, and Cost as Perceived Price. The direct impact on Behavioural Intention has made CVA an important approach in telecommunication, energy and other industries in tracking and forecasting competitive positioning. CVA is a predictive measure of business growth when it is based on a representative sample of the total market. Cost is measured relative to competition and can either be the actual costs or as a perception when the price is complex, customer-specific or difficult to access. For some services
Cost is simply what is paid, for others this measure it needs to include time costs or other things a person consciously gives up to access your service. For a quick-service restaurant client, the time taken to travel to the restaurant was an important cost. The chart below shows the value map used in Customer Value Analysis and which can also be used in service experience tracking to uncover insights into business performance when customers use more than one company, such as in banking, telecommunications, and retail.
This map shows Service Quality compared to Value perceptions for each competitor. Companies with relatively high quality and lower relative costs are predicted to grow, while those on the opposite side are predicted to decline. Stability comes from sitting along the line of fair value.

Click to enlarge
Satisfaction and Behaviour Intention
Satisfaction is an emotionally expressed evaluation of an experience and provides a link to understanding how evaluations of specific service elements are translated into behavioural intentions. Without understanding satisfaction levels we lose the understanding of how customers feel about what we do and as a result, we are less able to predict the impact of service delivery changes. An insight area that is lost when we jump straight to measuring Behavioural Intentions.
Our approach behavioural intention is to create a measure which reflects the type of behaviour that impacts business performance. For example in banking this is the likelihood to open an account with another provider, while for retailer is was to repeat purchase. For an education provider, recommendation was more appropriate. Likelihood to recommend used to create the NPS is a Behaviour Intention measurement, however, intention measures like buying or switching is more direct measure of what outcome we want while satisfaction more cleanly measures emotional evaluation.
At this stage that asking customers how to improve, or what lead them to be dissatisfied with the service makes the most sense. The interview process has helped them to recall the detail of their experience and to think about what impressed them or undermined the experience.
Implementing your own customer experience evaluation programme
When creating a customer evaluation programme or exploring service design and improvement start with a holistic model of how customers evaluate your service and its links to the behaviour that drives customer lifetime value. Having a model of how customer experience is evaluated increases the chances you will uncover delivery issues and highlights where you are missing a critical part of the story. It also helps to show the relative importance of any area in driving defection. When building your customer evaluation programme use the five areas listed below to ensure your programmes long term success.
- Determine Your Focus. Is the focus on evaluating delivery or predicting attrition rates? If both areas are important then the survey may need to be split to ensure it is done at times that maximise accuracy and insight.
- Map Points of Engagement. Determine which engagement points to measure. Focus on those engagement touchpoints that are most critical and with the potential to go wrong. Measuring an engagement touchpoint which is automated and habitual is best addressed in design research.
- Define Product Performance Dimensions. This is not about describing your product but its ability to delivering on its promise. If you want to track changes in what customers’ value, treat this independently to delivery evaluation.
- Determine Customer Costs. Look not just at what price is paid but all things a customer must sacrifice to access your product.
- Implement and Integrate into Business Control Systems. Once the programme is implemented, set your KPI and relay the results back to the accountable teams reliably and transparently. Do not be afraid to remove measures that do not significantly add to your understanding of the customer experience.
The service experience model outlined above is a powerful tool for improving business performance especially when combined with experimental changes in service delivery and internal information on changes to delivery and market information. While the approach can form the basis for service evaluation tracking studies it also provides a framework for exploring service issues and improvement in a qualitative setting.
For those who like to dig deeper. . .
- Parasuraman, Zeithaml and Berry, “SERVQUAL: A Multiple-Item Scale for Measuring Customer Perceptions of Service Quality,” Journal of Retailing, Spring 1988, pp. 12-40
- Cronin, Brady and Hult, T. M. (2000) “Assessing the effects of quality, value, customer satisfaction on consumer behavioral intentions in service, Journal of Marketing 59(1), 78-94.
- Gale (1994) “Managing Customer Value: Creating Quality and Service That Customers Can See ”, New York, The Free Press